700 Days
It will soon be two years since the tragic incident on Breiðamerkurjökull that eventually led to the formation of Fagráð and my nomination as its chairman. Time for a review.
I should add that not all of this work was in my capacity of the chairperson of Fagráð – in fact much of it has been strictly self funded. But I think seeing it all in context made the most sense.
I would not say that we started from scratch with our efforts – there had always been an informal exchange of information between operators, and courses on ice cave guiding have been ongoing since 2021. But clearly there was a need to do better. Where to start? What can be done?
First Steps
Frankly, I would not have been surprised if ice cave tours had been shut down entirely for the coming season, to allow for a thorough re-evaluation of all processes involved in guiding these locations. But of course this would have had very dramatic consequences for many operators in the area and quite possibly driven some of them into financial ruin. At the same time, ice caves had been visited for years in winter conditions (when they are inherently more stable than in summer), and the consensus was that allowing companies to operate their tours was going to be an option.
Fagráð took a very active role in the first winter, and at least one of us – often two, or three – was independently evaluating the various locations every two or three days, and even more frequently if conditions changed. This was often followed by long nights of conversations, both within Fagráð and in online meetings with lead guides from the various companies. Not all decisions to close locations were very popular (and, in retrospect, also not always necessary), but we learned.
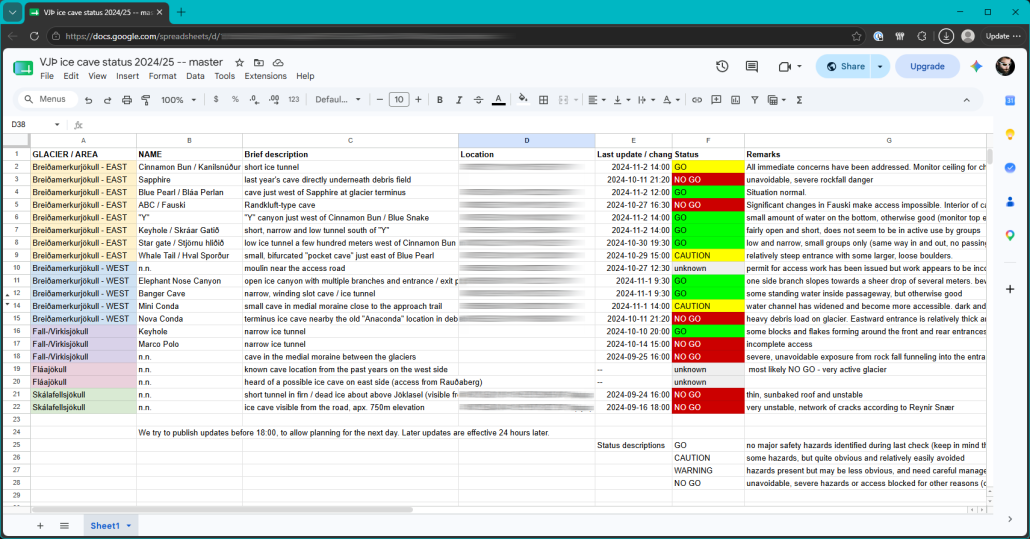
To ensure everybody was informed on current conditions, a simple Google Sheets document was set up that listed the known locations and their status, plus some remarks. It was clunky, error prone, there was no good way to add more in-depth information, and it was definitely not a permanent solution.
Still, it was a start. We began to have a shared view of the situation.
GLACIS 1.0
From these early steps, I started to also have a better understanding of what information might be useful to share between operators. And, most importantly, I thought it would be very useful to see how conditions would evolve over time – is a location slowly but surely deteriorating to the point of being permanently closed, or is the current status a temporary issue that can be resolved?
Fortunately, this is not the first time I have been in this situation. Before moving to Iceland, I have worked on a multitude of projects in the geospatial and information sharing sector – most notably one that was a prototype for shared public-private situational awareness and preparedness for critical infrastructure. So I had a good idea where to start.
It took a few weeks to get an early prototype off the ground, but by mid November we could replace the Google Sheet with a proper website. This first iteration was more of a proof of concept and would need a major overhaul at a later date, but it gave me the flexibility to experiment with the overall structure and data management.
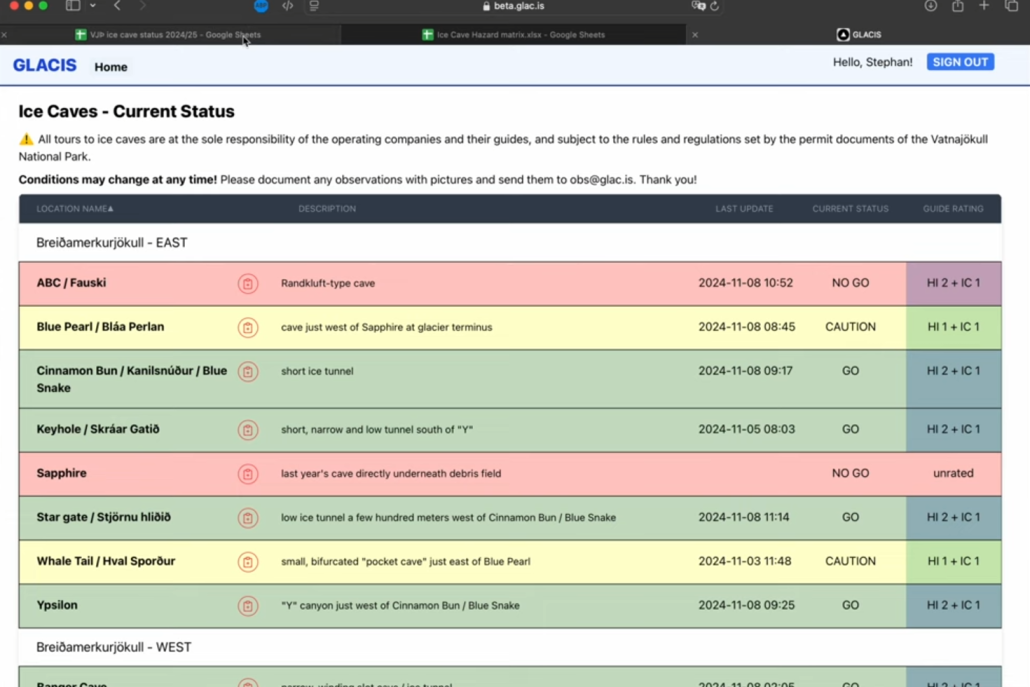
Most importantly, it now allowed all registered users to begin entering their own observations, and review them against all other assessments that had previously been entered. We had gone from a one-way information flow to a true shared knowledge space.
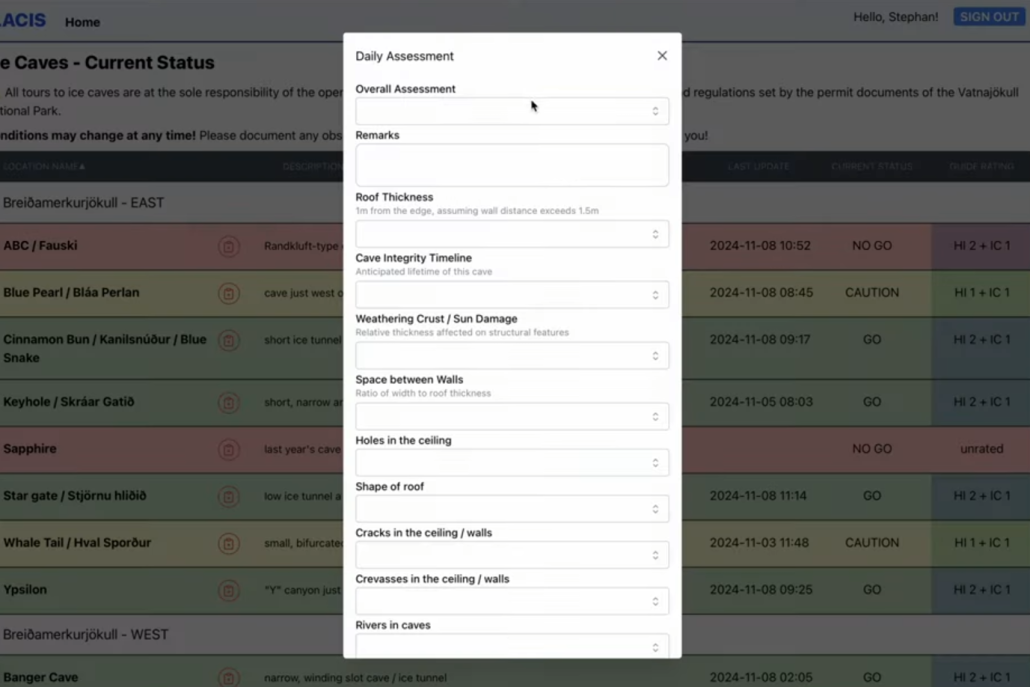
I had many more ideas about where to go from here, but the system was immediately adopted with such enthusiasm that I was very reluctant to make any further changes during the ongoing ice cave season. Further improvements would need to wait until the following summer, but one thing was clear: GLACIS had already proven itself to be useful.
Better Information
This proved to me that there was a clear pathway forward when it came to collaborative information sharing and shared situational awareness, but two other questions remained open: how can we ensure good decision making takes place, objective and independent of commerical pressures, and which additional information could Fagráð provide to assist in the process?
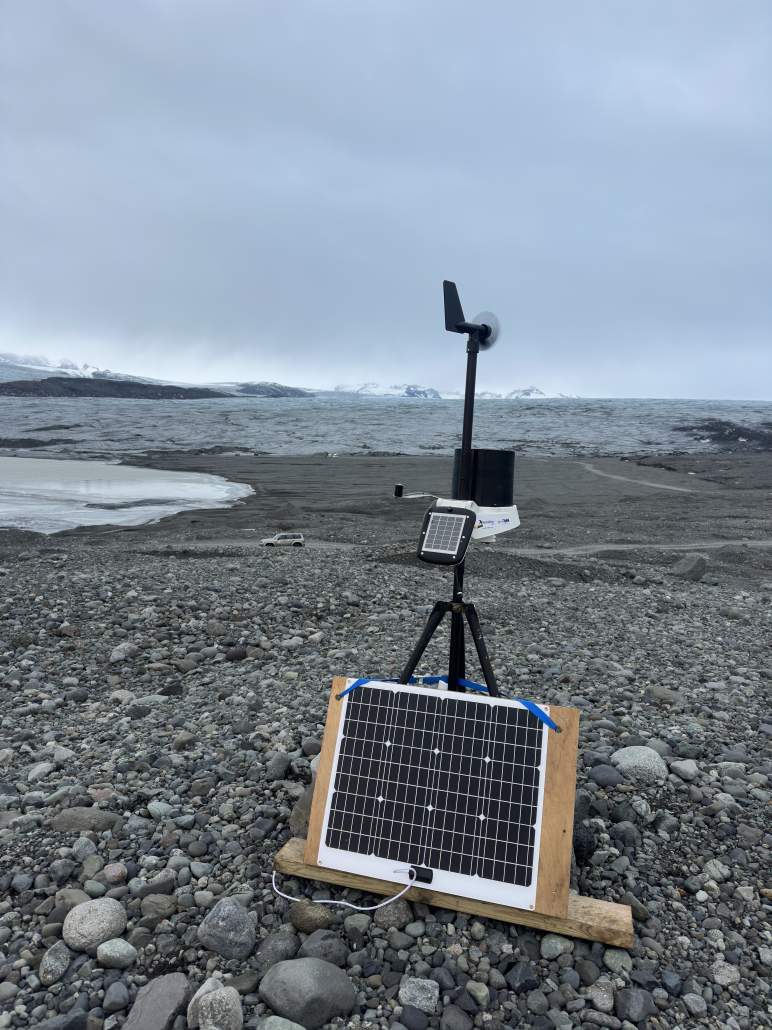
Weather Stations
One of the easiest and most obvious tools would be better, localized weather data. We started with a weather station in Þröng on the eastern periphery of Breiðamerkurjökull, which was a good proving ground close to multiple popular locations in the 2024/2025 winter. It worked rather well, and eventually further weather stations on Falljökull, at Jökulsárlón, and the west side of Breiðamerkurjökull. Unfortunately after a year of reliable operations, we have been plagued by outages and technical failures in the past winter, but I am hopefull we will be able to get those resolved over the coming weeks and months.
Another critical point was a recurring theme of discussions about the thickness of the roof in a particular ice cave. Due to the complexity of this location it was not easy to determine this with certainty just by observation, so I began to look into other options.
Maybe ground-penetrating radar might work? I spoke to a number of geophysicists, and they basically told me that it was not going to provide the information we were looking for. Their suggestion was fairly simple: just drill a hole! That, of course, would have not been very popular and also not always feasible. But maybe there would be other options?
3D Scanning
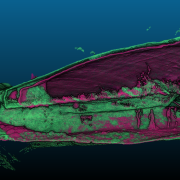
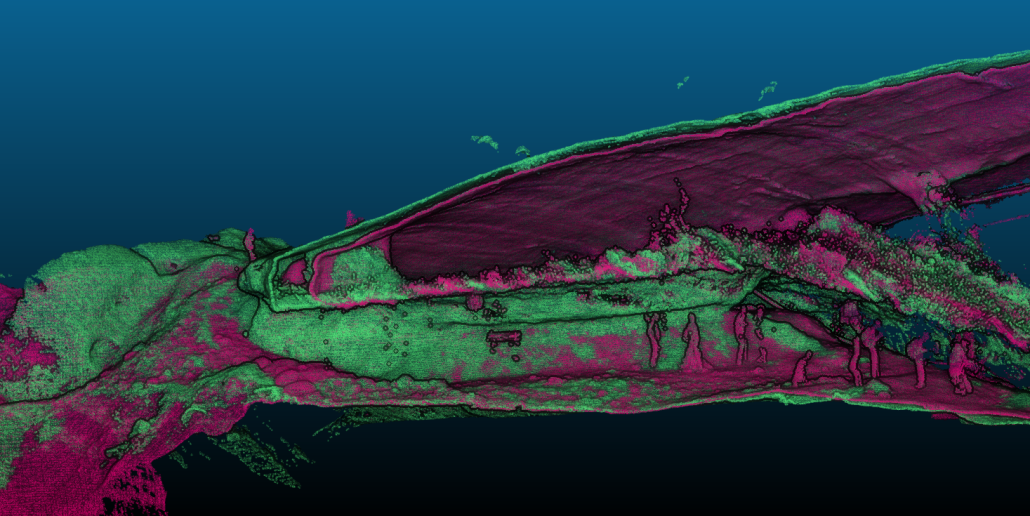
I had previously worked both with photogrammetry and LIDAR based data acquisition, and knew it was going to be tricky to get high quality photogrammetry in an environment that was full of reflections and transparency. But I was somewhat hopeful with LIDAR. So in early 2025, I went ahead and arranged for rental high-end LIDAR scanners (both a Leica RTC360, and the much more compact and lightweight BLK360) to make some trial scans.
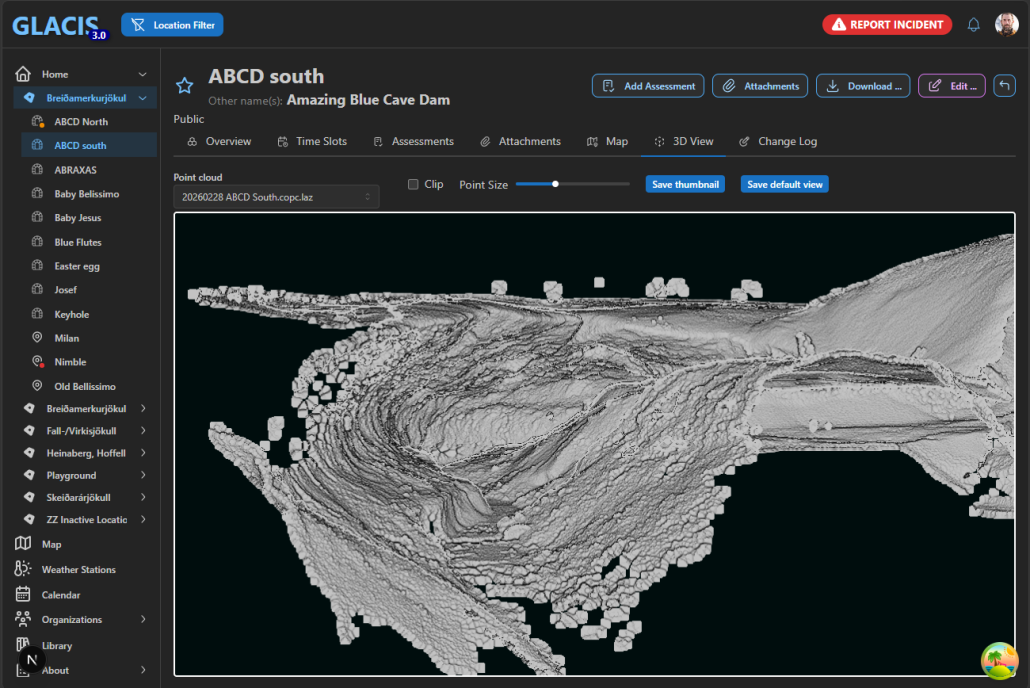
The quality of those scans was remarkably good – the highly transparent ice surfaces also caused quite a bit of noise which made alignment of the individual scan positions somewhat problematic, but we finally were able to develop a full understanding of even the most complex ice caves and their exact situation underneath a complex surface topography.
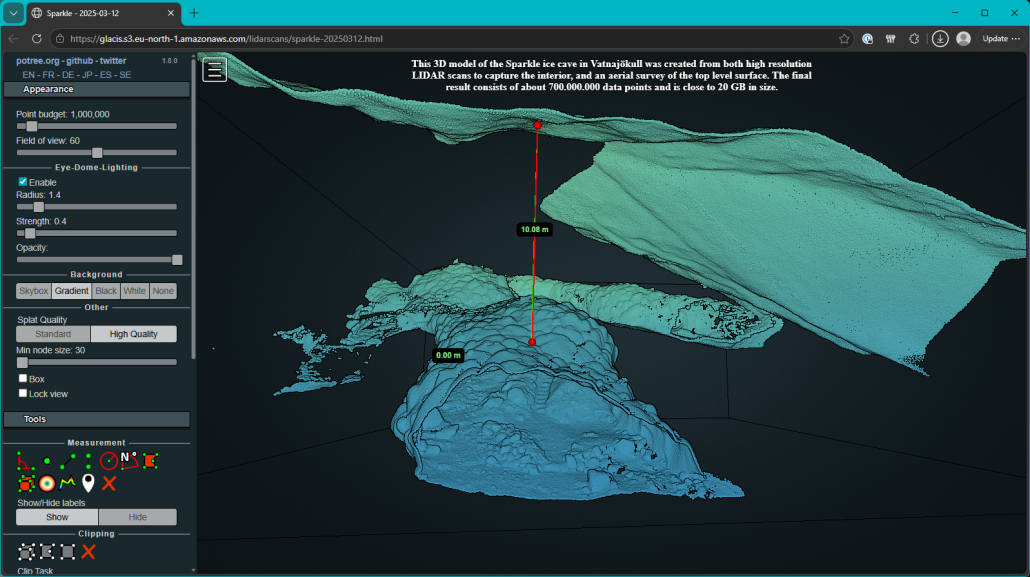
Initial processing and handling of the laser scan data required a very powerful computer, but the finished and optimized data sets are in a format that can be progressively loaded and therefore even viewed on the web – even though they still require a rather stunning amount of storage space (hence why I am hosting them on AWS S3 storage). Here is a link to the viewer shown above:
https://glacis.s3.eu-north-1.amazonaws.com/lidarscans/sparkle-20250312.html
Over time I got the process dialed in, but with about 30-60 individual scans to be set up, captured, and eventually combined to a complete three-dimensional model of an average sized ice cave, the process will never be efficient enough to provide answers in “real time”. 36 to 48 hours are more realistic, which is certainly fast enough to track slower and progressive changes – and those are really the ones I was most interested in because they occur at a rate that is not easily perceived, but still relevant.
Taking the leap
These scans worked so well that prior to the 2025/26 season I decided to invest in a scanner myself. This was a massive investment, but renting is quite expensive as well and was not going to be a viable solution when it comes to repeated captures at short notice. And it is those repeat measurements are where things are getting really interesting – not only do we now have a static snapshot of a cave structure, but by carefully aligning the models taken at different times we can begin to see the changes.
These alignments are tricky because in many situations there are no fixed reference points: every aspect of the cave may move or change between captures. There are ways in which this might be resolved, but interpreting the result is always going to take time and experience.
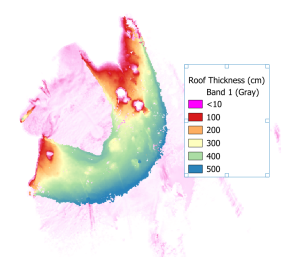
In any case, interactive 3D models are great for these explorations because they give the user a tremendous amount of possibilities. But when trying to answer specific questions and communicate them, it often makes sense to go one step further and condense the data into a more concrete form. For example, how is the thickness of the ice distributed across the roof?
This, too can be answered with a bit of processing.
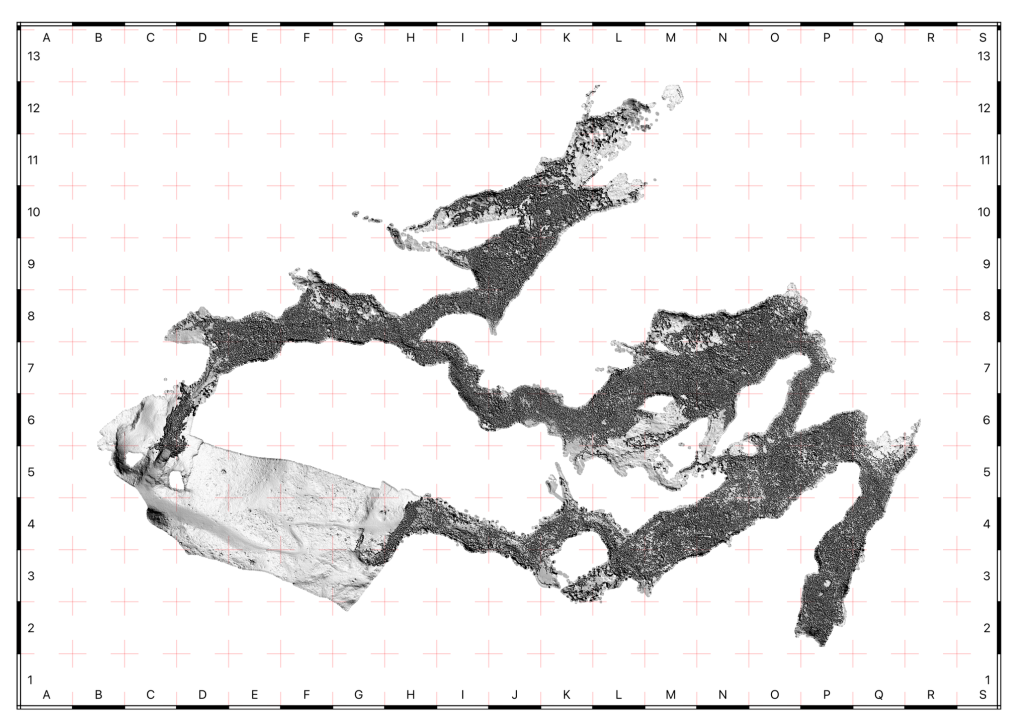
Mapping ice caves at a larger scale also facilitates communication about particular sections of the location. Most caves we deal with are relatively small and straightforward to discuss, but there can sometimes be a complex situation where having a reference grid can be helpful. The best example was the “Sparkle” ice cave of the 2024/25 winter, which was quite remarkable in extent and number of side passages.
Photogrammetry
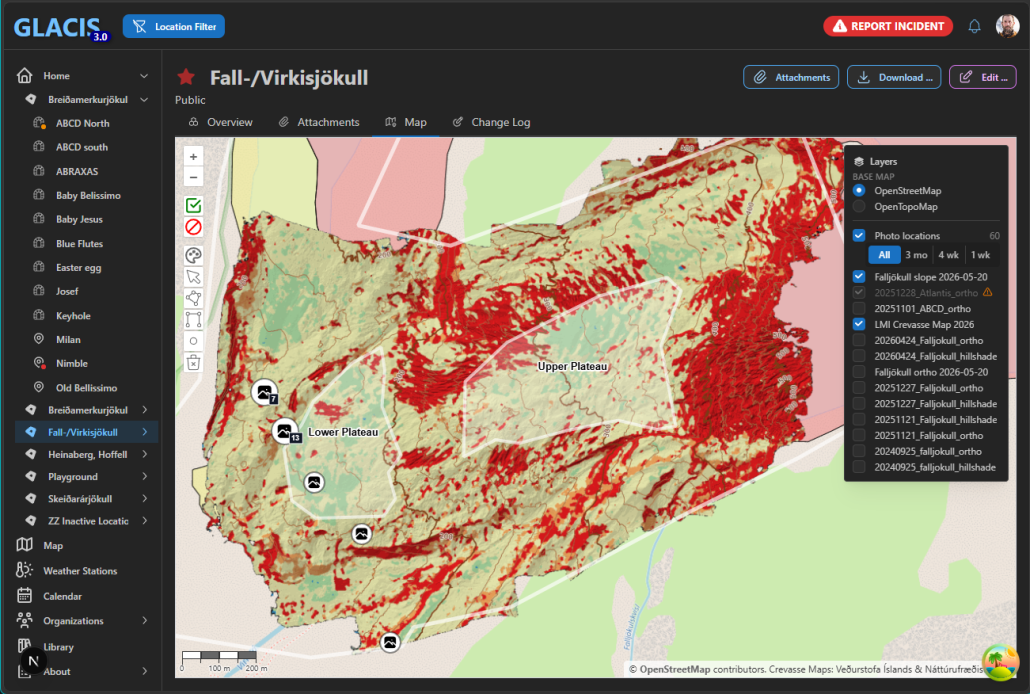
Talking about mapping, this also was a great topic of interest on the glacier more generally. For larger surface areas, a terrestrial laser scanner is not really the right tool; this is where aerial photogrammetry shines. I first had the idea of opportunistic glacier mapping in 2018, primarily to see how far one can get with nothing but a consumer-level drone in the backpack and a bit of time, for example while customers were having a lunch break.
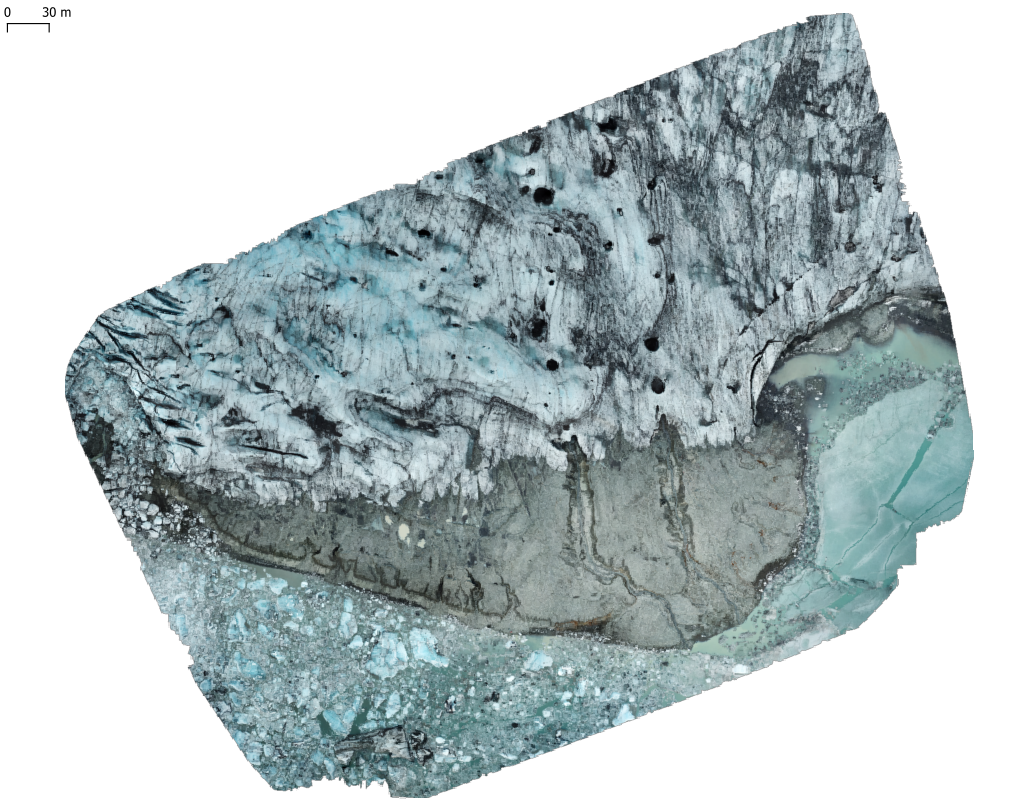
Our expectations have evolved in the meantime, and especially when it comes to aligning those large-area photogrammetry captures with terrestrial LIDAR scans demands on precision and repeatability are quite a bit higher – although not insurmountable. But even with just high quality photogrammetry we can deliver some high value information, and easily surpass commercially available satellite imagery by one or two orders of magnitude. Even early attempts such as the image above achieved 5cm orthoimage resolutions, whereas commercially available “super resolution” imagery is only 2 or 3 meters.
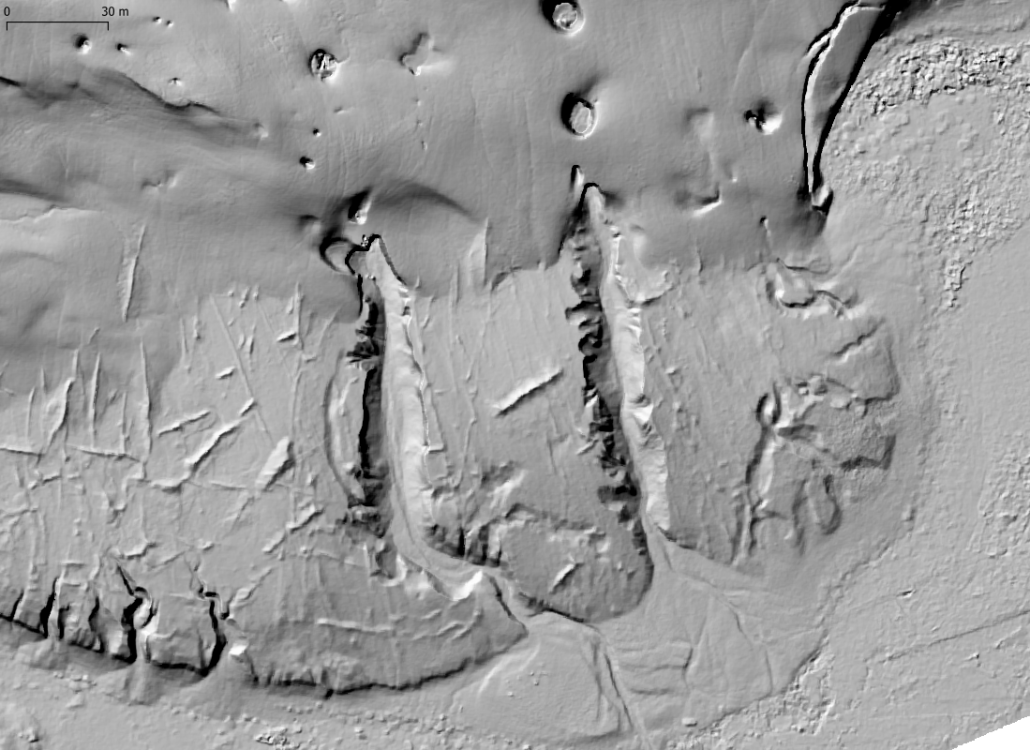
And, while orthophotos are nice, but they don’t always reveal the shape and structure of the terrain. This is where a digital surface model helps, especially if it can be produced at high enough resolution to resolve smaller scale surface details. Because of how the computational process works, the geometric models are usually at lower resolution than the resulting orthoimagery, but not necessarily. In the example of Treasure Island, the DSM is at the same resolution, and at 5cm even smaller features become apparent and the different structure of the glacier and surrounding landscape is clearly apparent.
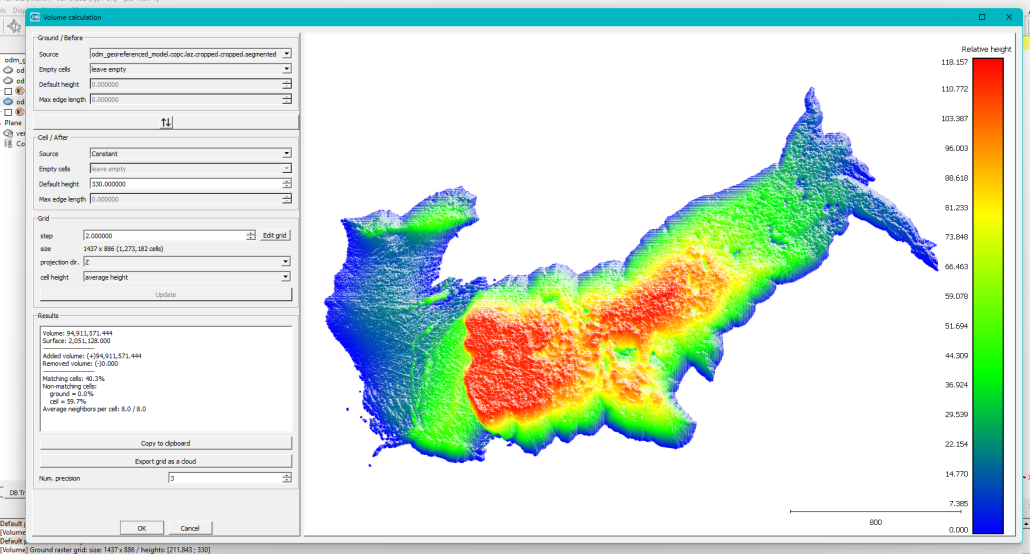
This photogrammetry expertise also came to good use recently when I was able to quickly respond to a Jökuhlaup event in Innri-Veðurárdalur and create a topographic map of the now-empty valley floor. From this data and the high water mark it was possible to estimate the total volume of water discharged in the event. While similar data is available from remote sensing satellites, the resolution achieved by photogrammetry is several orders of magnitude better.
GLACIS 2.0 and the 2025/26 Season
Over the summer of 2025, I took the lessons learned from the prototype portal and started to work on what ended up being “version 2.0” but really was the first proper version of the system. The most notable changes were a map display of the various locations, the option to upload photos and associate them with all these places, and the possibilty for users to add locations themselves. I also experimented with supporting the entry of time slots where companies might be able to enter the anticipated tour schedules (which might have helped with avoiding times of heavy “rush hour” traffic), but those ended up not being used at all.
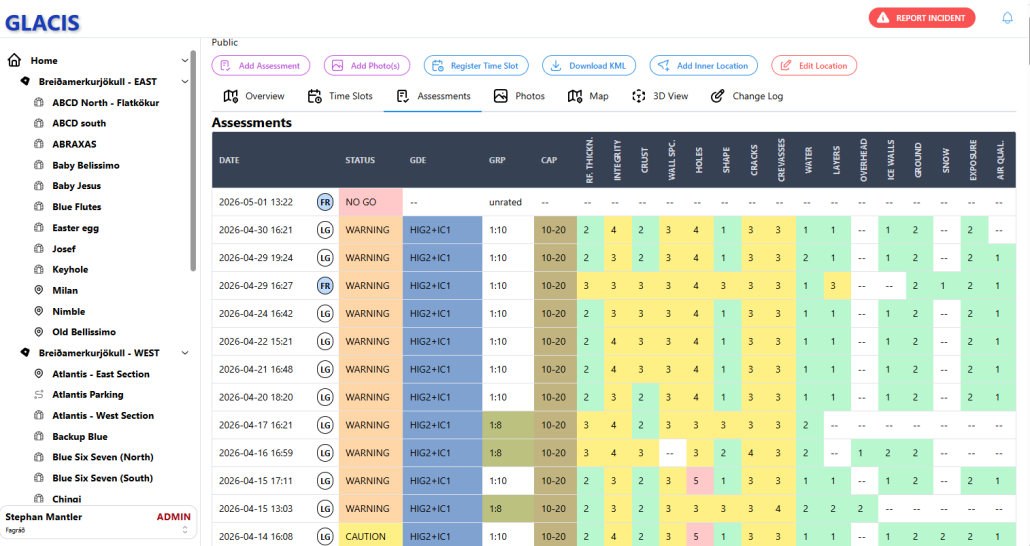
Assessment Groups and Fagráð
The past winter also saw some changes to Fagráð and the assessment groups.
The accident in 2024 of course severely disrupted the inherent trust the Vatnajökull National Park – and other authorities – were ready to put into the judgment of tour operators, and it would take some time to rebuild this. Consequently, Fagráð took a quite active position in many decisions in the 2024/25 season, but one of the main topics of discussion over the past years had often been how involved it should be with the daily operations and assessments of individual locations in the long term. Having a relatively small group creates a multitude of issues:
- The limited manpower does not not scale well to even a moderate number of locations, and consequently negatively impacts the frequency and quality of any assessments that can be made by members of Fagráð alone.
- Since members of Fagráð are, by definition, also employees or possibly owners of companies operating tours, any actions or decisions made solely by Fagráð may be perceived as being biased towards their operational preferences.
- There are over two dozen tour operators in the Vatnajökull National Park, many with a tremendous amount of experience and excellent track record. Disregarding their expertise in assessing locations is, simply said, stupid.
- The final decision and responsibility must always remain with the guides in the field. Not incorporating them as much as possible in the assessment process sends the wrong signal of ‘those decisions are being made for you’.
For the 2025/26 season, we tried to restructure the way assessments are made. Instead of having mostly online meetings with the occasional on-site conversations like we did in the previous winter, I suggested focusing as much as possible on on-location assessment group meetings. We arrived at having those meetings every other week, on separate mornings for each of the general areas (east and west side of Breiðamerkurjökull, and Falljökull) where companies would attend those they actually operated in. Members of Fagráð (usually me, and often one or two additional members) would also attend these meetings and provide additional input, but the goal was always to make the final assessment decisions as a group.
A monthly “general” assessment group meeting was held online to discuss things that were of importance to everybody, and of course additional meetings (both on location and online) would be scheduled whenever deemed necessary.
In my opinion those meetings were a great improvement, both with getting more experience and opinions into the assessment process (which also made this more transparent to everybody) and encouraging companies to be active in their role. But there was some friction with this approach as well, for example the timing of those meetings was difficult for owner-operators who could not participate due to their own tour schedules (but could more easily make room for an onlin meeting in the later afternoon or evening), and the communication of meeting outcomes could certainly be improved as well.
Going into 2026
All of these processes provided a good foundation of data, but opened up a new question: how to share the various data I am producing, in a way that makes it most useful to the guiding community? I also observed that people were taking screenshots and drawing annotations on them, to point out various features. That felt clunky and brittle, and needed a better solution.
From a technical perspective, it was time to revisit GLACIS. Work on the next generation of the portal started almost immediately after it went online originally, but it was a major effort and required careful planning to ensure it is the right foundation to build upon. I have many ideas about future improvements, but it made most sense to keep the first release of this rewrite within a relatively narrow scope.
The platform will also provide deeper integration for the 3D data I have been collecting, including a more functional 3D viewer, the ability to view multiple data sets for a single location (and see its changes over time), manage viewpoints, and more.
Summer Assessment Groups
I expect the work of Fagráð and the Assessment Groups will continue to evolve at a similar pace – it feels like we are beginning to hit a groove and on Falljökull there has been strong interest from the companies to keep the on-site meetings going over the summer months. This shows to me that they see a tangible benefit to these conversations. There is not always a specific and urgent agenda, but there is always an exchange of observations, ideas and concerns.
Those meetings are completely voluntary, and I am not sure whether they would make as much sense in all areas, but it is clear to me that it is extremely valuable to build opportunities for guides to get together in a way that they find useful. Because this is how we build a strong community that transcends company boundaries.
Course Work and Training
Earlier this summer I created a questionnaire that was sent out to the 300+ guides who have attended the AIMG ice cave course in the past. Similar questionnaires have been sent out directly after the conclusion of the courses, but I wanted to gather feedback that was more focused on their view after having worked for at least one season after the course: did anything come up during their guide work that the course had not addressed well enough? Were there any points that turned out to be mostly irrelevant?
This feedback will be the foundation for revising the ice cave course over the summer. While I believe the current curriculum is already a good primer, the survey certainly provides a wealth of valuable information about how the course can be made more useful to the guides and give them the best possible tools for their work.
A cynic’s work is never done
In summary, I believe that one should never be fully satisfied with the status quo, but constantly strive for improvement. Much is left to be done, but looking back at the past two years I would like to think that the time was well used.
I am incredibly grateful for all the support and trust I have received from everybody involved, including the National Park and members of Fagráð, but especially from all the companies. Without them, none of this would have been possible.